Lesson
Dashboard
Lesson 1
Family Selection
Lesson 2
Family Data File
Lesson 3
Attendance
Lesson 4
Provider Participation
Lesson 5
Provider Reimbursement
Lesson 6
Parent Involvement & Education
Lesson 7
Health & Social Services
Lesson 8
Site Licensure
Lesson 9
Adult-Child Ratios
Lesson 10
Environment Rating Scale
Lesson 11
Nutritional Needs
Lesson 12
Desired Results Profile & Data
Lesson 13
Qualified Director
Lesson 14
Staff Development/Provider Support
Lesson 15
Refrain from Religious Instruction
Lesson 16
Inventory Records
Lesson 17
Annual Evaluation Plan
Lesson 18
Fiscal Essentials: CFCC Contract Type
Introduction to Projections
A successful organization:
Must have sound fiscal management
Manages enrollment & projections to ensure their contract is fully maximized
Reference
Watch Video Lesson ❯
Sample Forms/Tools ❯
Review Sketch Pad Notes ❯
Gather
When preparing an enrollment & projections plan, you must gather the following information:
Contract
Program Type
Maximum Reimbursable Amount (MRA)
Provider Budget
Minimum Days of Operation (MDO)
Predict
Interest Revenue
Family Fee Revenue
Average Child Cost
Average Drop Rate
Plan
There are many worksheets out there that programs use to create an enrollment & projections plan.
To show what should be considered when planning enrollment & projections we will be using Monarch Link’s sample workbook that is built for the California Family Child Care Home Education Network (CFCC Contracts).
For the purpose of planning, within the worksheet the TEAL COLOR CELLS are inputted AND adjusted as changes occur, while the SALMON COLOR CELLS are updated monthly.
Program Overview Data
Enter data into Program Overview section for each program.
EXAMPLE:
TOTAL BUDGET:
Contract MRA: Contract Maximum Reimbursable Amount (MRA) is $3,779,550
Family Fees: Based on predicted fees, the projected family fees are $20,225
Interest: Predicting to receive $500 of interest (amount of interest received from program funds sitting in the bank account)
PROVIDER BUDGET:
Provider Budget: Total Budget x 70% = Provider Payment Budget
$3,800,275 (Total Budget) x 70% = $2,660,193 (Total Provider Payments)
MINIMUM DAYS OF OPERATION:
Day of Operation: A day in which the contractor’s administrative office is open for business.
Minimum Days of Operation (MDO): MDO of 246 was determined by the annual service calendar & included on contract face sheet.
Composition
Next, we’ll need to determine the average child cost, child count and projected payments per month. Let’s walk through this.
EXAMPLE:
AVERAGE CHILD COST:
Based on prior year’s average child cost & takes into consideration months where children are expected to use more care
NOTE: Throughout the year, as you enter the actual provider payment paid out per month, you will start to build the average child cost history for the upcoming fiscal year.
CHILD COUNT:
To determine how many children are needed to earn the contract:
Provider Budget $2,660,193/Average Annual Child Cost 5,508 = 483 Children Every Month
NOTE: Based on this example & in a perfect world, this agency must have 483 children enrolled on July 1st AND carry the same enrollment count throughout the entire program year in order to earn the entire contract.
PROJECTED PROVIDER PAYMENTS:
The projected provider payments will populate based on the average child cost times the child count for each month.
Manage
In a typical year, it is important to complete monthly projections. It is not a good idea to wait until you receive the quarterly Earnings Projection Worksheet from the Department to see their projections.
When you are over- or under-earning, you must respond quickly. By the time you can enroll 1 family up to 4 months may have gone by.
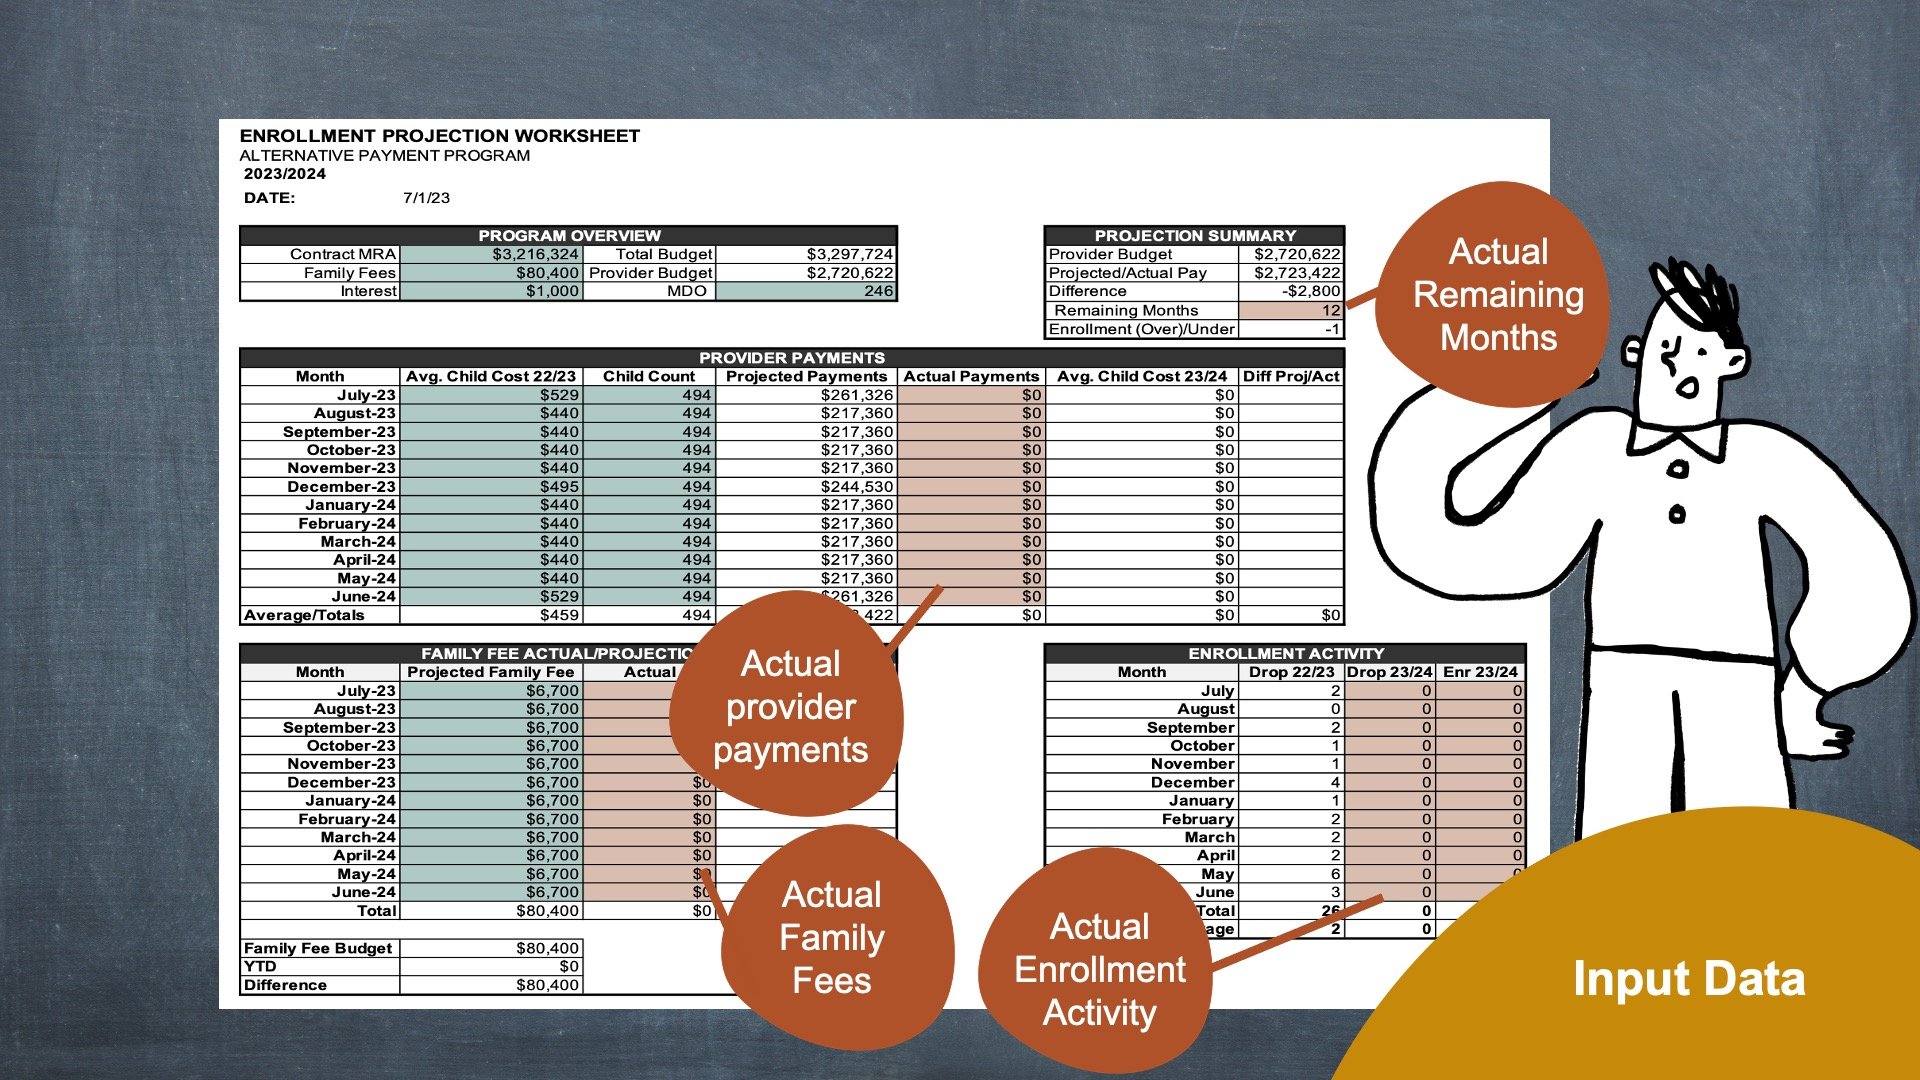
Input "Actuals"
To manage projections, each month you will need to input the Actuals
For the purpose of managing projections, within the worksheet the SALMON COLOR CELLS must be updated monthly to determine if child enrollment needs adjusted
Actual Provider Payments: Actual total of payments made to providers
Actual Family Fees: For this fiscal year, input the total amount of family fees assessed. How much would you have received if fees were not waived?
Actual Enrollment Activity: Input the number of dropped & enrolled child
Actual Remaining Days: Input the days of operation remaining
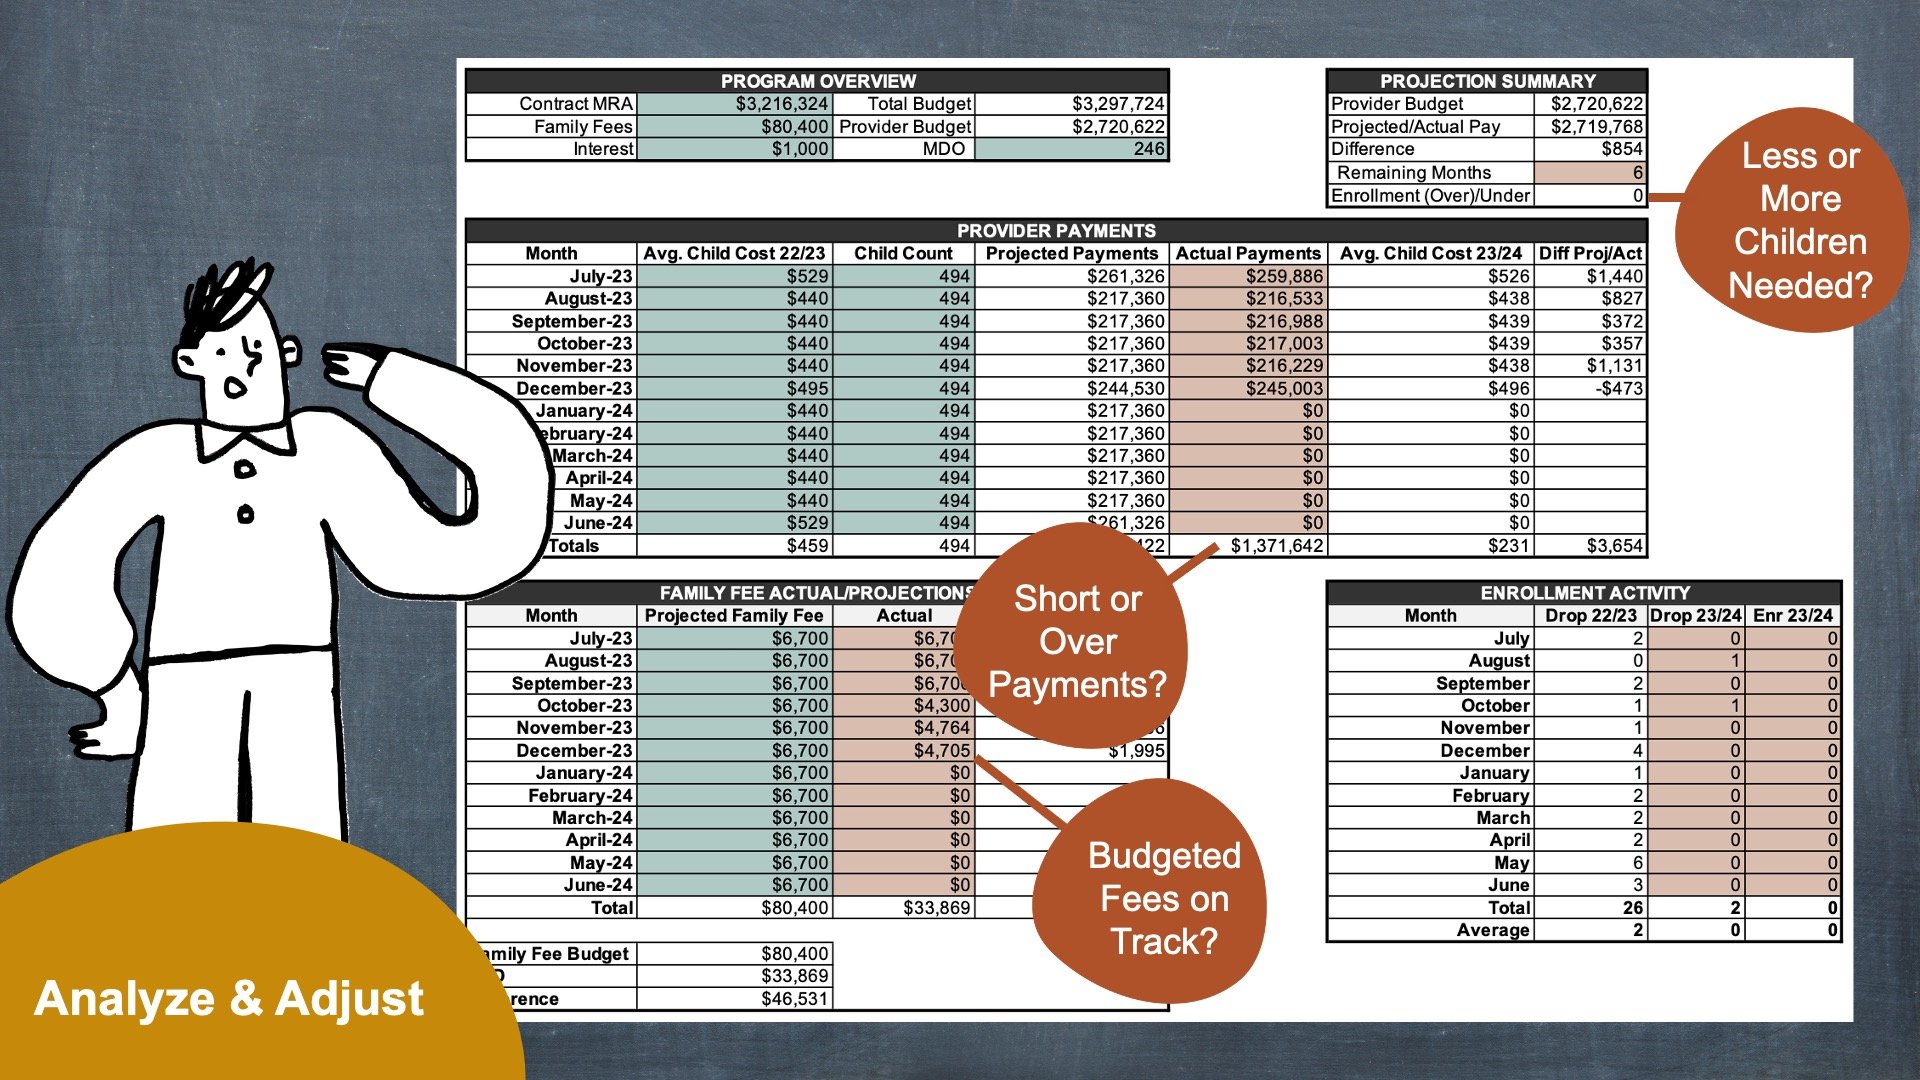
Analyze & Adjust (if needed)
Closely monitor provider payments, family fees & enrollment activity. When analyzing the projection worksheet, ask yourself?
Is the drop & enrollment counts on track?
Compare projected fees vs. actual fees. Are budgeted fees on track?
Based on expended provider payments, is the program short (under-earning/enrolled) or over (over-earning/enrolled)?
If under-earning/enrolled, how many more children do we need to enroll?
If over-earning/enrolled, can we afford to keep the current amount of children enrolled? Do we have a nice “cushion” to support any potential future under-earning/enrollment?
Complete Knowledge Check ❯
After reviewing the video lesson & sketch pad notes, it’s time to check for understanding by completing a Knowledge Check. Note that Individual Knowledge Checks will conclude with a Certificate.


